Does Content Quality Actually Predict Google Rankings? I Analyzed 44,000 Pages to Find Out.

I scored 44,465 SERP results across 2,212 US keywords using LLM-based content quality rubrics, then tested whether those scores predict Google rankings after controlling for domain authority. Here's what I found.
The Question Nobody Can Answer With Data
The SEO industry runs on an article of faith: create great content and you'll rank. Google's own guidelines say as much. But when you ask "how much does content quality actually matter compared to domain authority?" — nobody has the data.
I decided to find out.
What I Did
I built a pipeline to test a straightforward hypothesis:
H1: After controlling for domain authority, content quality scores are negatively correlated with SERP position (higher quality → higher rank).
The Dataset
- 2,212 US keywords from Ahrefs (Informational + Commercial intent, non-branded)
- Top 30 results for each keyword via Serper API
- 60,409 SERP results crawled and extracted to markdown using rs-trafilatura
- 44,465 pages scored after filtering for extraction quality
- Domain authority for 8,169 unique domains via DataForSEO Backlinks API
The Scoring
Before scoring anything at scale, I ran a 150-page pilot test comparing MiMo-V2-Flash against Claude Opus 4.6. Agreement was strong (Spearman ρ = 0.766, Cohen's κ = 0.747), so I went ahead. Each page got scored on three dimensions:
| Rubric | Based On | What It Measures |
|---|---|---|
| Content Effort | Google's leaked contentEffort signal | How much genuine effort went into this? Could an AI replicate it in minutes? |
| Originality | Google's leaked originalContentScore signal | Does this add new knowledge, or just reorganise what's already out there? |
| Topical Coherence | Google's page2vecLq signal | Does every section serve the core topic, or does the page wander? |
Each rubric scored 1-5 with calibration rules, worked examples, and false-positive traps I've refined over several client projects. The rubrics, not the model, do the heavy lifting — the scoring prompts are detailed enough that any capable LLM produces similar results, which is why the pilot showed strong agreement across two very different models. I've published the full rubrics with worked examples separately if you want to score your own content.
A Note on Statistical Significance
With 44,000 observations, statistical significance is trivially easy to hit — even tiny, meaningless effects show p < 0.001. So I'm focusing on effect sizes, practical significance, and whether findings hold across multiple methods rather than p-values. If the effect isn't large enough to matter in practice, I don't care that it's "statistically significant."
The Methods
I didn't rely on a single test. I used 8 independent methods to triangulate. Methods 3 and 5 properly handle the nested structure (multiple pages competing for the same keyword aren't independent); the others don't, so their p-values come with that caveat:
- Spearman rank correlation
- Partial Spearman (controlling for domain authority)
- Within-keyword rank analysis (comparing pages competing for the same query)
- Permutation test (1,000 shuffles for gold-standard p-values)
- Linear mixed-effects model (handles nesting)
- OLS with clustered standard errors
- Logistic regression for top-10 probability
- Random forest with SHAP feature importance
The Results
Yes, Content Quality Predicts Rankings — But How Much?
All 8 methods pointed the same way. Content quality is associated with higher rankings, even after controlling for domain authority.
But the effect size is what matters here, not the p-values.
Domain Authority Is 10x More Important
The random forest (trained on 35,621 pages, validated on 8,844 held-out pages, R² = 0.178) makes it stark:
| Feature | Importance |
|---|---|
| Domain Authority | 49.7% |
| Word Count | 31.6% |
| Keyword Difficulty | 11.8% |
| Topical Coherence | 3.7% |
| Content Effort | 1.7% |
| Originality | 1.5% |
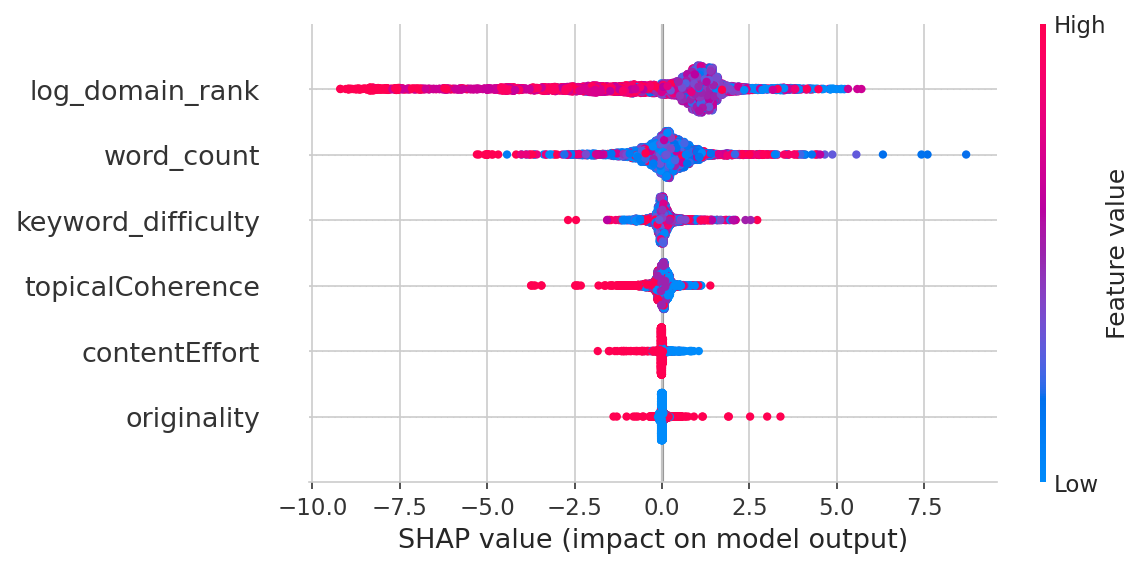
Domain authority alone accounts for half the variation in rankings. Content quality collectively accounts for about 7%. And the full model only explains 18% of what's going on — the other 82% is factors I didn't measure (page-level backlinks, user engagement, Core Web Vitals, brand signals, etc.). For context, published SEO ranking factor studies typically report R² values of 0.10-0.25. No model explains most of Google's ranking decisions — if one did, we'd all be retired.
But That 7% Is Real and Consistent
Across all 8 methods, the signal holds up:
| Method | Finding | p-value |
|---|---|---|
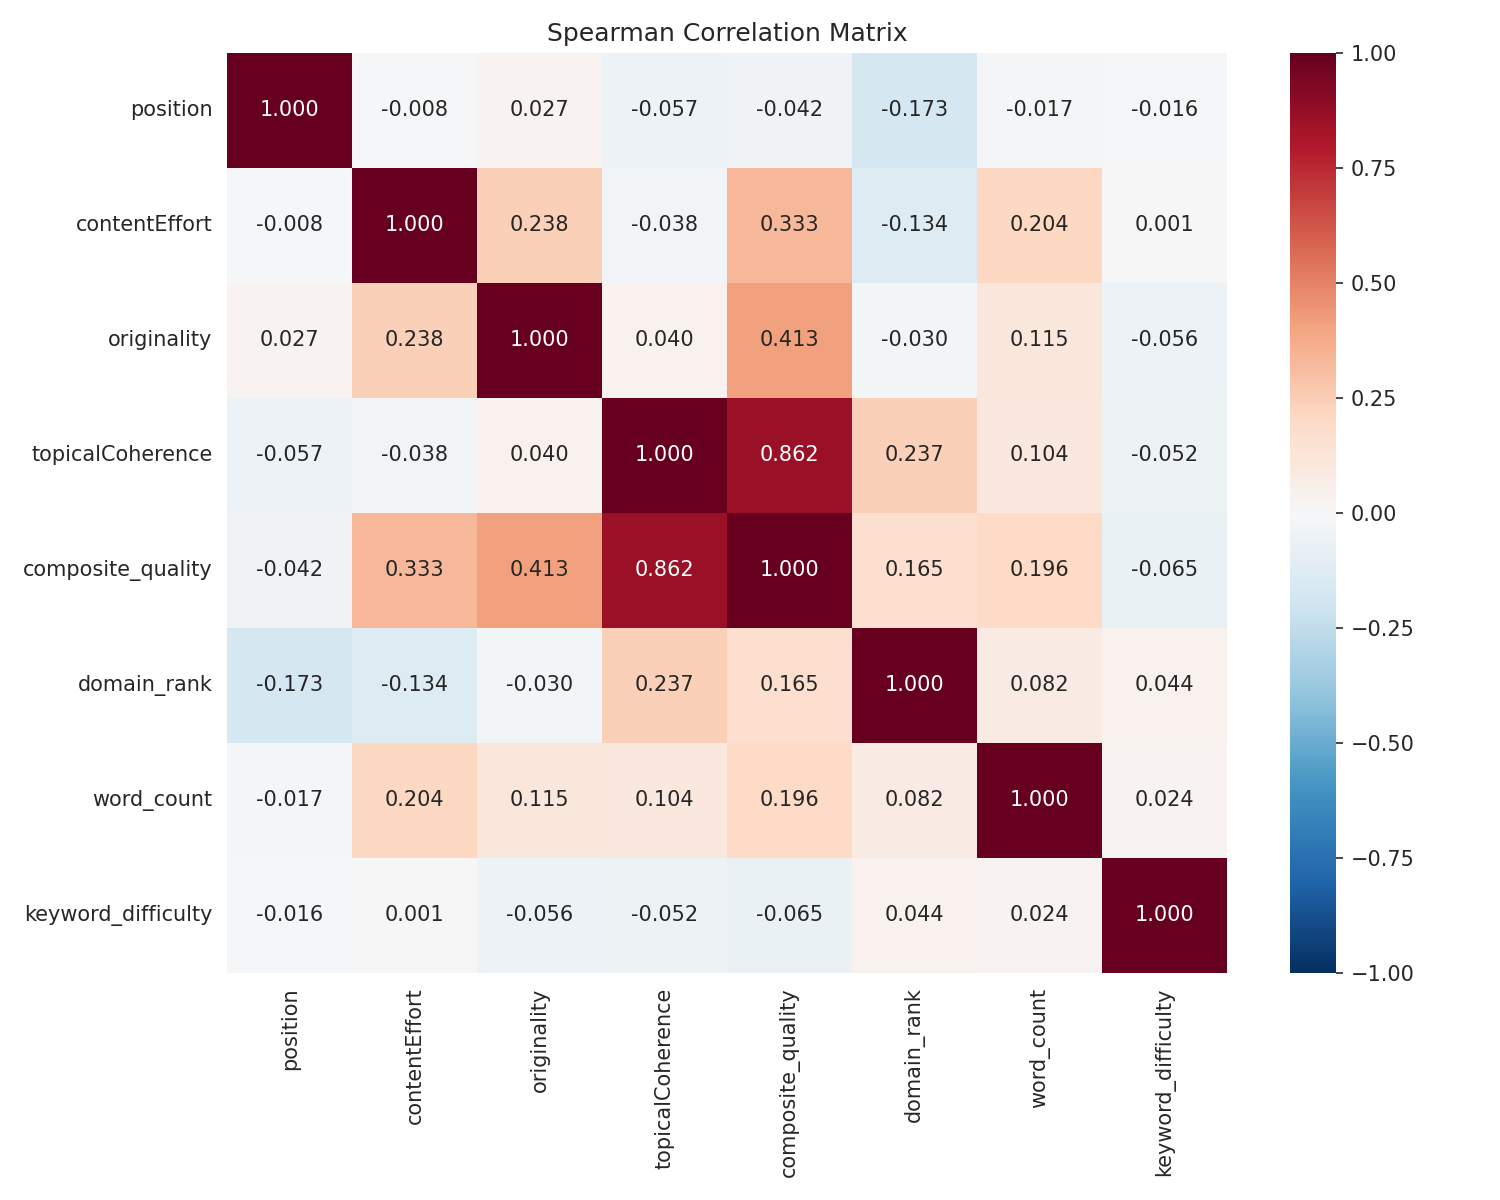
| Spearman (raw) | Topical coherence: ρ = -0.057 | p < 0.001 |
| Partial Spearman (controlling DA) | Still there: ρ = -0.017 | p < 0.001 |
| Within-keyword analysis | Median ρ = -0.066, quality predicts rank in 60.5% of keywords | Bootstrap CI: [-0.080, -0.051] |
| Permutation test | 11 standard deviations from null | p < 0.001 |
| Mixed-effects model | -0.23 positions per coherence point | p < 0.001 |
| OLS clustered | -0.51 positions per composite point | p < 0.001 |
| Logistic (top-10) | +4.7% odds per coherence point | p < 0.001 |
The permutation test — which makes no distributional assumptions and properly handles the nesting — puts this beyond doubt.
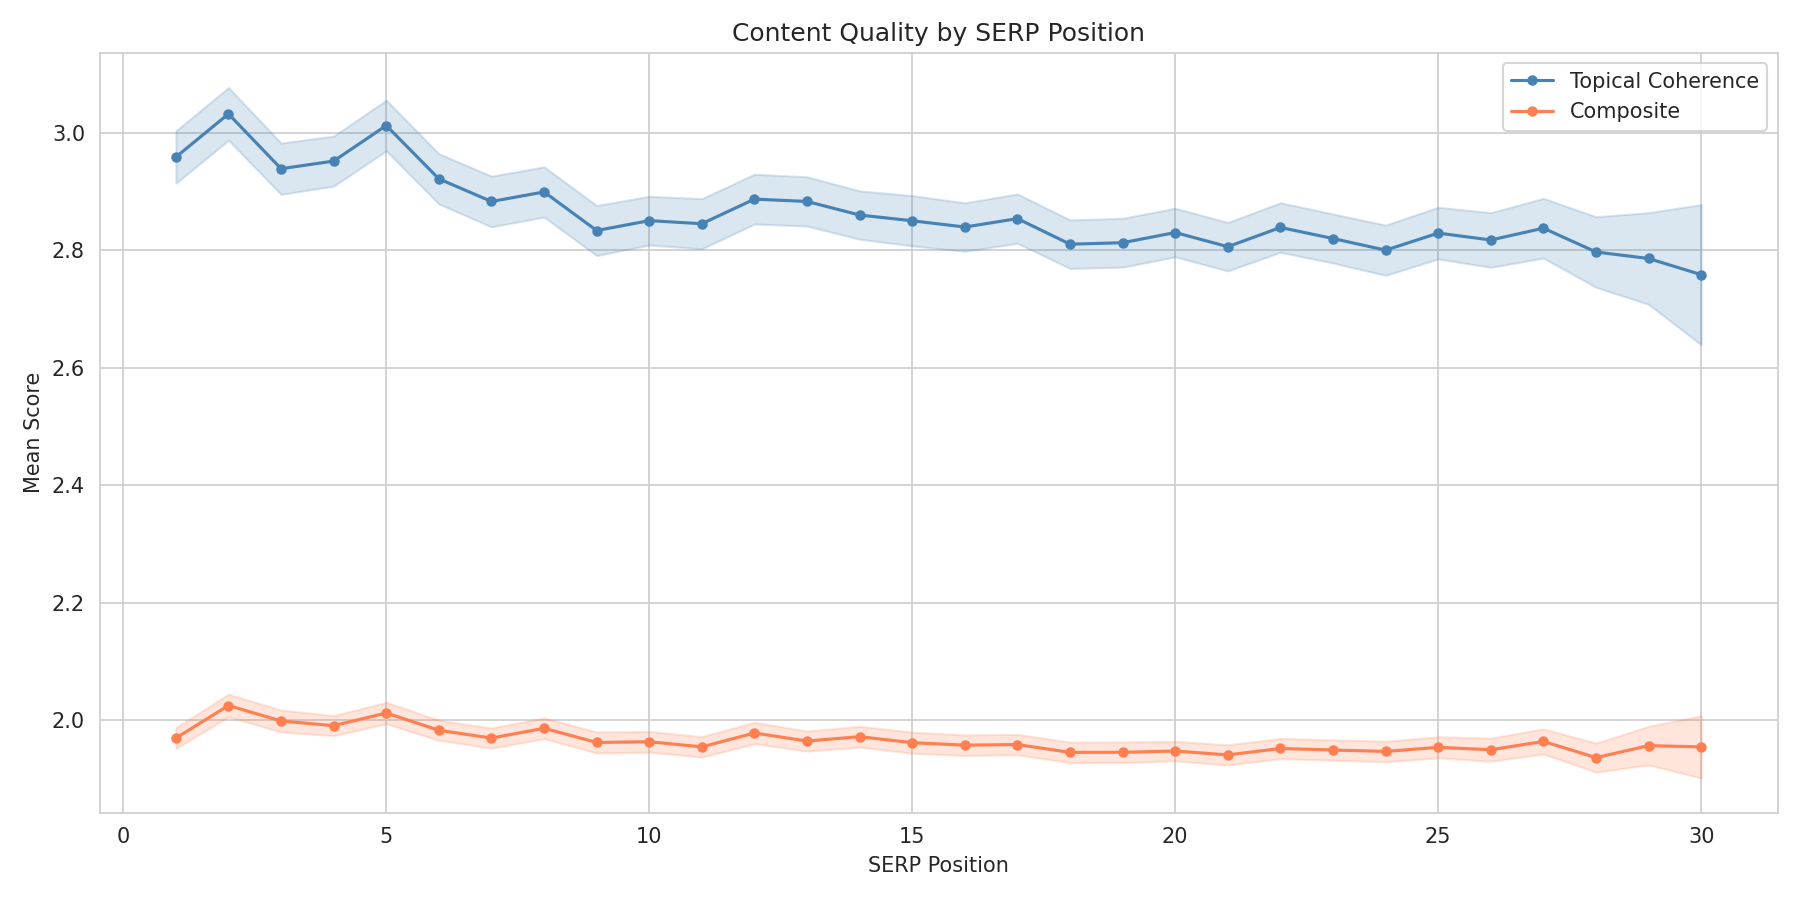
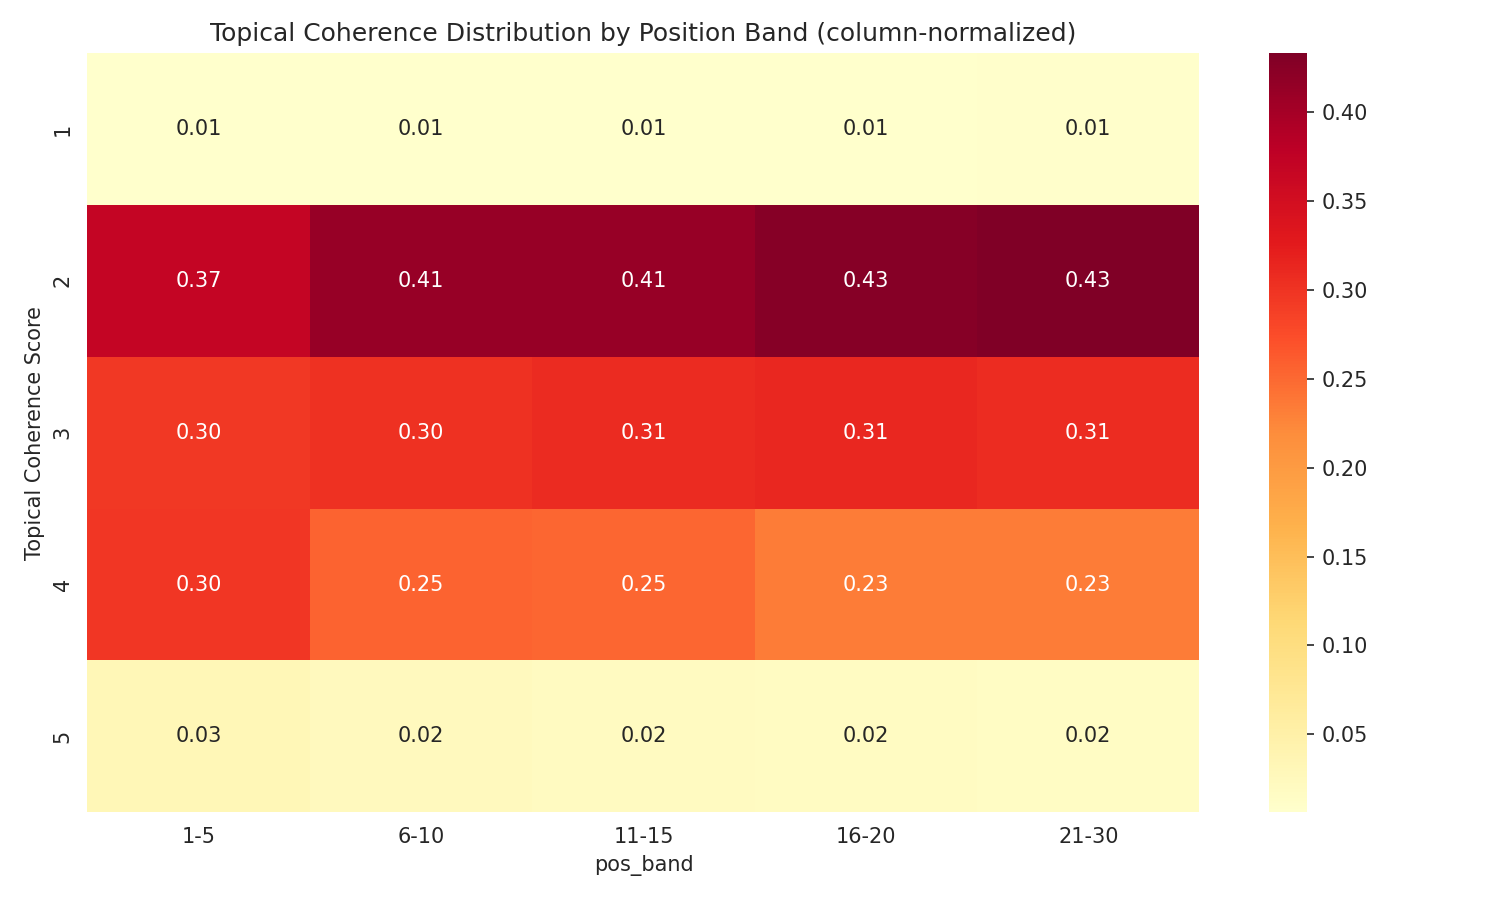
The Topical Coherence Effect
Of the three dimensions, topical coherence showed the clearest link to rank. Pages that stay on topic rank higher than pages that try to cover everything.
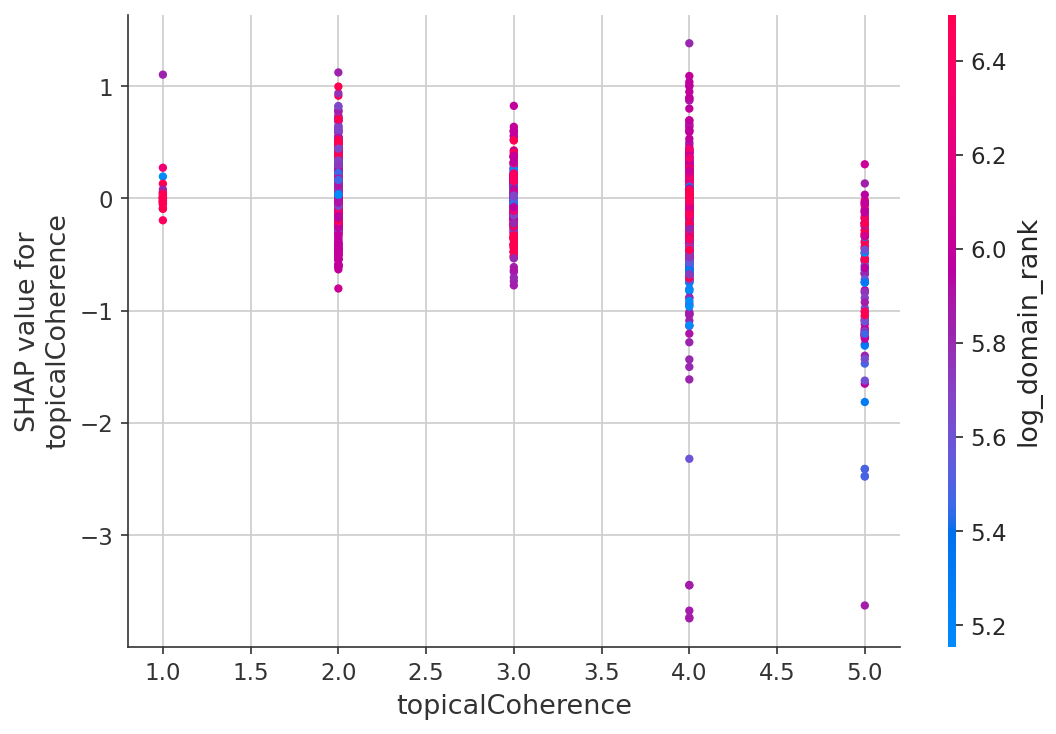
| Topical Coherence Score | Mean Position | Top-10 Rate |
|---|---|---|
| 1 (Incoherent) | 15.27 | 32.0% |
| 2 (Unfocused) | 14.53 | 34.9% |
| 3 (Adequate) | 14.27 | 36.1% |
| 4 (Well Focused) | 13.52 | 40.2% |
| 5 (Highly Focused) | 12.27 | 47.2% |
A page scoring 5 on topical coherence has a 47.2% top-10 rate vs 32.0% for score 1 — a 15 percentage point gap. Fair warning: N=980 for score 5 and N=338 for score 1, so those tail estimates carry wider confidence intervals than the mid-range scores.
The Nuances That Matter
Content Quality Matters Most When You Don't Have Authority
This was the most interesting finding. I split the data by domain authority quartiles:
| Domain Authority | Coherence → Position ρ | Significant? |
|---|---|---|
| Q1 (lowest authority) | ρ = -0.059 | Yes (p < 0.001) |
| Q2 | ρ = -0.035 | Yes (p < 0.001) |
| Q3 | ρ = +0.018 | No |
| Q4 (highest authority) | ρ = +0.011 | No |
![]()
For low-authority domains, content quality is a real differentiator. For high-authority domains, it barely matters — they rank regardless.
Put simply: If you're Forbes, you can publish mediocre content and still rank. If you're a startup, content quality is one of the few levers you've actually got.
What I'd do with a bigger budget: I used domain-level authority because page-level backlink data for 44,000 URLs was outside my budget (I may return to this in the future). Domain authority is a blunt instrument — it tells you the site is strong, not whether this specific page has earned links. With page-level referring domain counts, I could test whether high-effort content attracts more backlinks at the page level, and whether the quality → rank effect works through link acquisition rather than being a direct signal. That's something I want to look at next.
Informational Keywords Are Where Content Matters
I tested whether the effect differs by search intent:
| Intent | Within-Keyword ρ | % Keywords Showing Effect |
|---|---|---|
| Informational only | -0.101 | 65% |
| Commercial + Informational | -0.041 | 56% |
The difference is clear (Fisher z-test, p < 0.001). Content quality matters 2.5x more for informational queries than commercial ones.
Easy Keywords Reward Quality More
| Keyword Difficulty | Within-Keyword ρ | % Negative |
|---|---|---|
| KD 0-20 (easy) | -0.080 | 63% |
| KD 21-40 | -0.081 | 64% |
| KD 41-60 | -0.048 | 56% |
| KD 61+ (hard) | -0.007 | 51% |
For competitive keywords, authority dominates so completely that content quality has almost no effect. For low-competition keywords, quality actually matters.
What Doesn't Work: Keyword Stuffing
One caveat here is that Google's BM25 that we assume is the relevance gate to being included in the primary index for a search term, has evolved over the years. Whilst I ran the vanilla BM25 scores (keyword relevance/density) and found something I didn't expect:
| Position Band | Mean BM25 Score |
|---|---|
| Top 1-5 | 3.950 |
| 6-10 | 3.967 |
| 11-20 | 4.016 |
| 21-30 | 4.056 |
Higher-ranking pages have slightly lower keyword density. The within-keyword analysis confirmed it: BM25 correlates positively with position (ρ = +0.045), meaning more keyword-stuffed pages rank worse.
Makes sense when you think about it. Top-ranking pages tend to be authoritative domains covering topics naturally. Lower-ranking pages are often over-optimised service pages hammering the keyword.
What This Means for Content Strategy
For many SEOs this is a bit of a
"so you are saying water is wet"
moment, and you would be right.
If You Have Low Domain Authority (< Median)
- Content quality is one of your best levers. A well-focused, coherent article has a measurably better shot at ranking than scattered, unfocused content.
- Topical coherence matters most. Pick ONE topic per page and cover it properly. Don't try to rank for five keywords with a single "ultimate guide."
- Target informational, low-KD keywords. That's where content quality has the strongest effect.
If You Have High Domain Authority
- Content quality gives you diminishing returns. Your authority already gets you ranked. Polishing content has a small marginal effect.
- Focus on authority maintenance — backlinks, brand, trust signals matter more than rewriting articles.
For Everyone
- Stop keyword stuffing. It's slightly counterproductive.
- Focus beats effort. A focused, coherent page outranks a long, scattered one — even if the scattered one took more work to produce.
What About Content Effort?
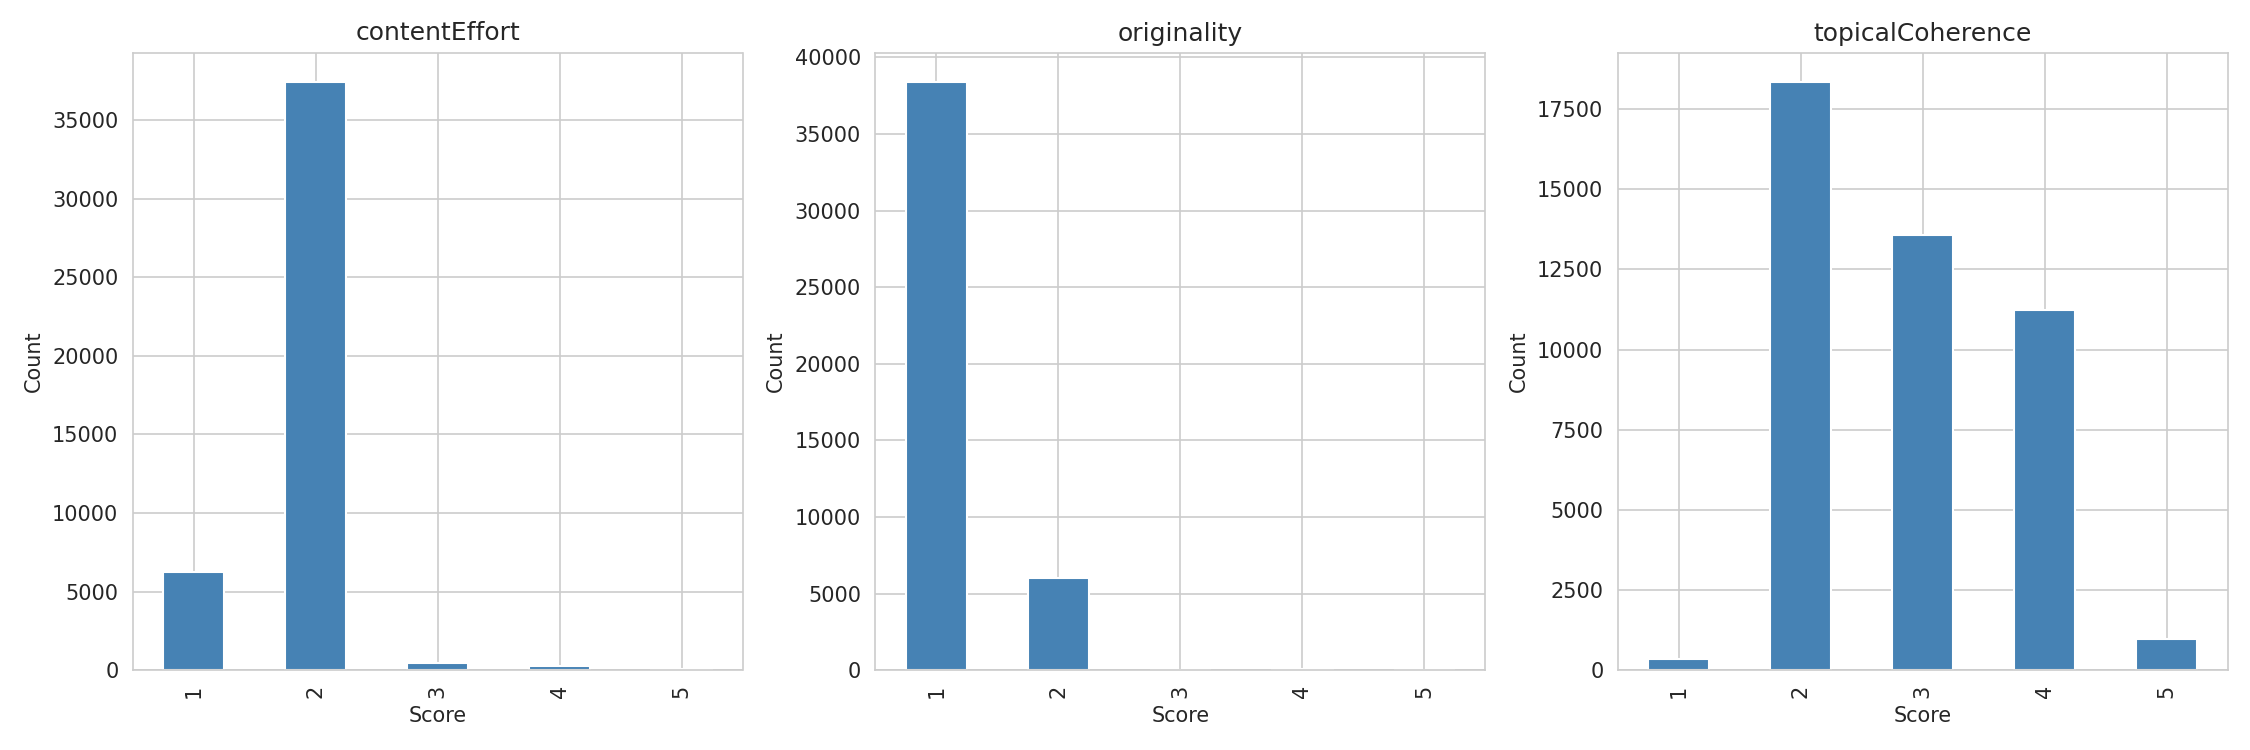
This one deserves its own discussion. I found no significant correlation between content effort scores and ranking within the normal range (scores 1-2). But 84% of pages scored 2 and 14% scored 1 — I was basically comparing "low effort" to "very low effort." Only 1.8% of pages in the top 30 had proprietary data, original research, or documented expertise.
That's not really a finding about whether effort matters. It's a finding about how rare genuine effort is. High-effort content is so uncommon in search results that I simply didn't have enough of it to measure the effect.
My working hypothesis — which this data can't prove but doesn't contradict — is that effort's ranking effect gets laundered through backlinks. High-effort content (original data, expert interviews, proprietary research) is citable. Citable content attracts links. Links build domain authority. And domain authority is the dominant ranking factor. So effort might matter enormously, but its effect shows up in the authority metric rather than as an independent quality signal.
If I had(When I have) page-level backlink data (rather than just domain-level), I could test whether high-effort pages attract more referring domains. That's the next study. My presumption is that these are highly correlated.
Originality: The Web Is Derivative
86% of pages ranking in the top 30 scored 1 on originality — fully derivative. That's not a bug in the scoring. Try the Google Test yourself: search for any informational query, read the top 10 results, and count how many contain a single claim you can't find in the other 9. Almost none.
The bar for "above average" originality is shockingly low. Google doesn't appear to heavily penalise derivative content — or if it does, the penalty is already baked into the authority signal (original content → citations → links → authority).
My view is that as LLMs take over more and more of the content writing responsibilities, that new and unique data points paired with demonstrated insight from experience will be more of a deciding factor, but the question is how can Google, etc measure this at scale?
Limitations
This study has real limitations worth being upfront about:
- LLM scoring is a proxy. MiMo-V2-Flash scored these pages, not Google's quality raters. LLM scores are noisy estimates, though the pilot validation (ρ = 0.766, κ = 0.747 vs Opus baseline) suggests they're reasonably consistent.
- Compressed score distributions. 84% of pages scored 2 on Content Effort and 86% scored 1 on Originality. That's not a scoring flaw — it's an accurate reflection of the web. Almost no ranking content contains proprietary data or original research. But it limits statistical power for those rubrics. Topical Coherence had the widest distribution (41% score 2, 30% score 3, 25% score 4) and showed the strongest signal — partly because it's the dimension where pages actually differ from each other.
- Cross-sectional design. I measured rankings and quality at one point in time. Can't prove that improving content quality causes ranking improvements — only that quality and rank are associated.
- Unmeasured confounds. I controlled for domain authority, word count, and keyword difficulty, but plenty of ranking factors weren't measured: backlink velocity, user engagement, Core Web Vitals, page speed, brand searches, etc. Domain authority and word count are also likely correlated (high-authority sites produce longer content), so word count's 31.6% feature importance may partly proxy for authority.
- Content extraction quality. rs-trafilatura handles articles well (F1 0.93) but can misextract product pages or SPAs, adding noise for some page types.
- Vanilla BM25. I used basic Okapi BM25 without field weighting, proximity scoring, or passage-level scoring. A BM25F implementation aligned with Google's patents would probably show different results.
- Multiple comparisons. I ran 50+ tests across methods, rubrics, and subgroups. Some findings at the margins might not survive Bonferroni correction. The core findings — topical coherence effect, DA quartile interaction, intent difference — hold up across multiple independent methods with consistent effect sizes.
Methodology Details
Data Collection
- Keywords: 2,212 US keywords from Ahrefs, filtered to Informational + Commercial intent, non-branded queries in the software development vertical
- SERP data: Serper API (3 pages of 10 per keyword = top 30 results)
- HTML download: httpx concurrent (94%), Playwright fallback for JS-rendered pages (4%)
- Content extraction: rs-trafilatura (Rust, F1 0.966 accuracy)
- Domain authority: DataForSEO Backlinks Summary API (domain-level rank, 0-1000 scale)
Scoring
- Model: Xiaomi MiMo-V2-Flash (309B MoE, 15B active parameters) via OpenRouter
- 3 rubrics × 44,465 pages = 133,395 API calls
- Total LLM scoring cost: ~$87
Statistical Analysis
- 8 independent methods with consistent results
- Primary method: within-keyword Spearman rank analysis with bootstrap CI and permutation test
- All code available in the research repository
Google-Algorithmus-Leak (Mai 2024)
Die in dieser Studie verwendeten Content-Quality-Signale – contentEffort, originalContentScore, page2vecLq – wurden aus geleakten internen Dokumenten der Google API identifiziert:
- King, M. (2024). "An Exploration of the Google Ranking Algorithm Leak." iPullRank. https://ipullrank.com/google-algo-leak
- Erste Analyse der versehentlich öffentlich gemachten Dokumente zum Google Content API Warehouse (2.596 Module, 14.014 Attribute).
- Anderson, S. (2024). "The contentEffort Attribute, The Helpful Content System and E-E-A-T — Is Gemini Behind the HCU?" Hobo Web. https://www.hobo-web.co.uk/the-contenteffort-attribute-the-helpful-content-system-and-e-e-a-t-is-gemini-behind-the-hcu/
- Detaillierte Analyse der Beziehung zwischen dem Attribut
contentEffortund dem Helpful-Content-System. - Fishkin, R. (2024). "An Anonymous Source Shared Thousands of Leaked Google Search API Documents with Me; Everyone in SEO Should See Them." SparkToro. https://sparktoro.com/blog/an-anonymous-source-shared-thousands-of-leaked-google-search-api-documents-with-me-everyone-in-seo-should-see-them/
- Unabhängige Veröffentlichung, die die Authentizität des Leaks bestätigte.
- Google (2024). Content API Warehouse-Dokumentation (Repository yoshi-code-bot/google-api-java-client-services, später gelöscht). Originalquelle, die die Definition des
googleapi.contentwarehouse-Moduls enthielt.
BM25 und gewichtete Feldsuche
- Robertson, S.E., Walker, S., Jones, S., Hancock-Beaulieu, M., & Gatford, M. (1995). "Okapi at TREC-3." In Proceedings of the Third Text REtrieval Conference (TREC-3). NIST.
- Grundlagenarbeit, die die BM25-Ranking-Funktion vorstellt, die für die Keyword-Relevanzanalyse dieser Studie verwendet wurde.
- Robertson, S.E., Zaragoza, H., & Taylor, M. (2004). "Simple BM25 Extension to Multiple Weighted Fields." In Proceedings of the Thirteenth ACM International Conference on Information and Knowledge Management (CIKM '04), pp. 42-49. https://doi.org/10.1145/1031171.1031181
- Stellt BM25F vor, eine feldgewichtete Erweiterung, die unterschiedliche Gewichte für Felder wie Titel, Haupttext und Ankertext ermöglicht. Es wird angenommen, dass die grundlegende Suchschicht von Google eine Variante dieser Technik verwendet.
- Robertson, S.E. & Zaragoza, H. (2009). "The Probabilistic Relevance Framework: BM25 and Beyond." Foundations and Trends in Information Retrieval, 3(4), pp. 333-389. https://doi.org/10.1561/1500000019
- Umfassende Untersuchung von BM25-Varianten, einschließlich BM25F, BM25+ und Näherungserweiterungen.
Google Passage Ranking
- Nayak, P. (2020). "How AI is powering a more helpful Google." Google Blog, 15. Oktober 2020. https://blog.google/products/search/search-on/
- Ankündigung des Passage-based Ranking. Ermöglicht es Google, einzelne Passagen innerhalb eines Dokuments zu bewerten, anstatt die gesamte Seite, was die Suchgenauigkeit bei langen Inhalten verbessert.
- Google Search Central (2021). "Passage Ranking launch." Februar 2021.
- Bestätigt das globale Rollout der passagenbasierten Indizierung. Verändert die Suchgrundlage, um für bestimmte Suchanfragen auf Passagen- statt auf Dokumentenebene zu bewerten.
Richtlinien für Qualitätsbewerter und E-E-A-T
- Google (2024). "Google Search Quality Evaluator Guidelines." Datiert März 2024. https://guidelines.raterhub.com/searchqualityevaluatorguidelines.pdf
- Offizielle Richtlinien, die von Googles menschlichen Qualitätsbewertern verwendet werden. Definieren die Kriterien für Expertise, Erfahrung, Autorität und Vertrauenswürdigkeit (E-E-A-T).
Tools und Datenquellen
-
rs-trafilatura
-
Rust-Portierung der Content-Extraction-Bibliothek trafilatura. Wird für die HTML-zu-Markdown-Konvertierung mit Entfernung von Boilerplate-Inhalt verwendet. F1-Score von 0,966 auf Article-Extraction-Benchmarks. 7-mal schneller als die Go-Implementierung.
-
Crawl4AI
-
Open-Source-Webcrawler und -Scraper mit LLM-Unterstützung. Wird für das Herunterladen von Seiten mit JavaScript-Unterstützung in der Wiederholungsphase via Playwright verwendet.
-
Serper API
-
Anbieter von Google-SERP-Daten. https://serper.dev
-
Wird verwendet, um die Top-30 organischen Suchergebnisse für jedes Keyword abzurufen.
-
DataForSEO Backlinks API
-
Domain-Autoritäts- und Backlink-Metriken. https://dataforseo.com
-
Wird verwendet, um den Domain-Rang (PageRank-Proxy, Skala 0-1000), die Anzahl der Backlinks und die Anzahl der verweisenden Domains zu erhalten.
-
MiMo-V2-Flash – 309B-Parameter (15B aktiv) Mixture-of-Experts-Modell von Xiaomi. Zugriff über OpenRouter. https://github.com/xiaomimimo/MiMo-V2-Flash
-
Wird für die groß angelegte Bewertung der Inhaltsqualität verwendet (Input 0,09 $/M Tokens, Output 0,29 $/M Tokens).
-
Claude Opus 4.6
-
Reasoning-Modell von Anthropic. Wird als Referenz für die Kalibrierung der LLM-Bewertung verwendet (Pilottest mit 150 Seiten).
Statistische Methoden
- Cohen, J. (1960). "A Coefficient of Agreement for Nominal Scales." Educational and Psychological Measurement, 20(1), pp. 37-46.
- Cohens Kappa, verwendet zur Berechnung der Interrater-Übereinstimmung bei der Validierung der LLM-Bewertung.
- Spearman, C. (1904). "The Proof and Measurement of Association between Two Things." The American Journal of Psychology, 15(1), pp. 72-101.
- Spearmans Rangkorrelation. Hauptstatistische Methode, die durchgehend in dieser Studie verwendet wird.
- Lundberg, S.M. & Lee, S.I. (2017). "A Unified Approach to Interpreting Model Predictions." In Advances in Neural Information Processing Systems 30 (NeurIPS 2017). https://arxiv.org/abs/1705.07874
- SHAP-Werte (SHapley Additive exPlanations). Werden für die Analyse der Merkmalswichtigkeit im Random-Forest-Modell verwendet.